11 Scenarios
- What is a scenario.
- Create a scenario.
A scenario is a what-if model. It allows you to explore and calculate different potential future situations (scenarios) without directly changing the values in your worksheet.
In a scenario, you assign different values to specific variable cells (known as changing cells) and then calculate the resulting effect of those changes on your designated result cells. The result cells contain formulas that reference the changing cells.
For example, you might want to compare best-case and worst-case scenarios for a coffee shop’s annual profit, based on varying costs. In this case, the result cell would be the cell where the profit is calculated, and the changing cells would be the cells containing the cost values.
Identifying the changing cells and the result cells is crucial when creating scenarios.
Using Excel’s Scenario Manager, you can create different sets of input data to calculate the corresponding outcomes. You can save each set as a named scenario (e.g., “Most Optimistic,” “Most Pessimistic,” etc.). Then, you can easily compare the different outcomes using a generated summary report. This report displays both the input values for the changing cells and the resulting values of the result cells.
It is recommended to always save the current situation in a scenario, for example under the name Current.
11.1 Coffee Bar
Figure 11.1 shows a calculation model for a coffee bar. The gray cells represent the variable cells.
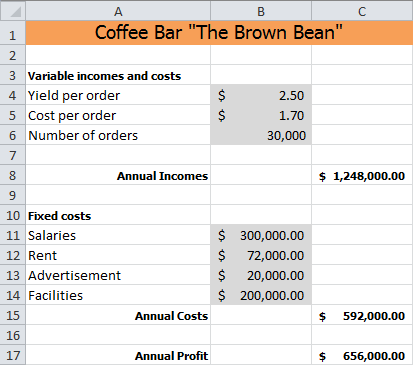
In addition to analyzing the current situation, the owner of “The Brown Bear” coffee bar wants to explore two other scenarios to understand their potential impact on profit:
- Higher prices, less salary and advertising:
-
This scenario involves a 10% increase in prices, a $30,000 reduction in salary expenses, and a $5,000 reduction in advertising expenses.
- Higher prices, less order costs and more advertising
-
This scenario features a 5% increase in prices, a 5% decrease in order costs, and a $2,000 increase in advertising expenses.
Task 11.1 File: BrownBean.xlsx
- Open the file.
Examine the model carefully. Identify the cells that will change and the cell that shows the final result. Review the formulas used and note that all cells have defined names.
Using meaningful names for your cells, rather than just cell addresses, will make the summary report easier to interpret.
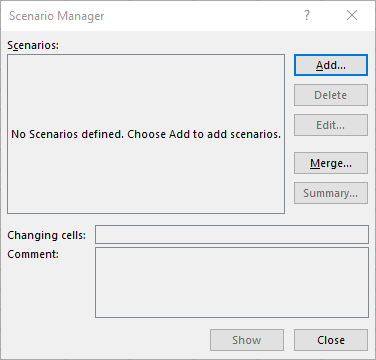
- Go to tab Data > What-If Analysis (Forecast group) > Scenario Manager.
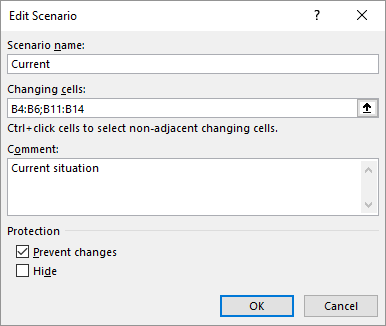
Click Add.
Complete the Add Scenario dialog box as shown in Figure 11.3. When selecting the Changing cells, use the CTRL key to select multiple ranges.
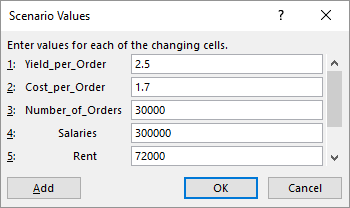
- Click OK. The Scenario Values window will appear, pre-filled with the current values of the changing cells.
Click Add to enter a new scenario.
Name the scenario “Higher prices, less salary and advertising”. Add a brief description if you’d like, and then click OK.
The Scenario Values dialog box will reappear, still displaying the current values of the changing cells.
Now, enter the new values for the cells that will change in this scenario. Instead of manually calculating these values, you can enter formulas, and Excel will automatically calculate the result.
- Yield_per_Order:
=1.1*2.5 - Salaries:
=300000-30000 - Advertisement:
=20000-5000
- Yield_per_Order:
Click OK.
If you’ve used formulas, a warning message will appear, indicating that the entered formulas will be replaced by their calculated results.
Confirm by clicking OK
- In the same way, create another scenario named “Higher prices, less order costs and more advertising” and adjust the cell values accordingly.
After you’ve added the last scenario, you’ll be taken back to the Scenario Manager dialog box, which will now list all three scenarios (Figure 11.5).
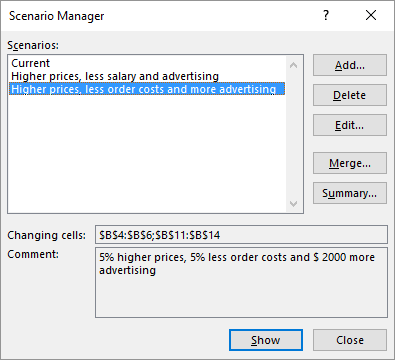
- Select each scenario one at a time, and then click Show.
In the worksheet, the values in the changing cells, and the cells that are dependent on them, will be updated to reflect the selected scenario.
- Click Summary to generate a report.
A dialog box will appear (Figure 11.6), allowing you to choose the type of summary you want. The result cell (containing the profit calculation) will already be filled in by Excel.
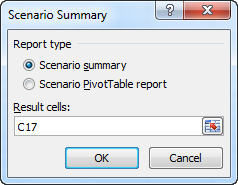
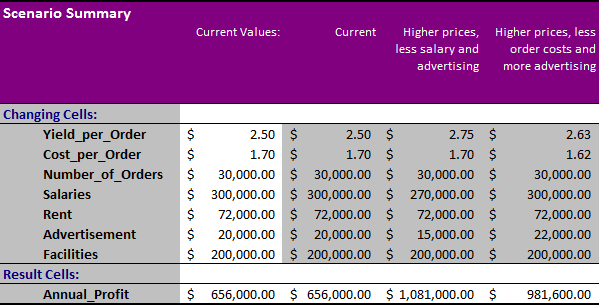
- Click OK.
A summary report will be created in a new worksheet. Notice that the left column displays the assigned cell names, rather than cell addresses, making the report easier to understand.
11.2 Exercises
Exercise 11.1 Profit Margin - Sales Price (scen001)
File: Scen001.xlsx
Create the following table as accurately as possible. Use formulas to calculate the margin, VAT, and selling prices.
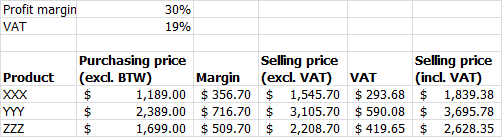
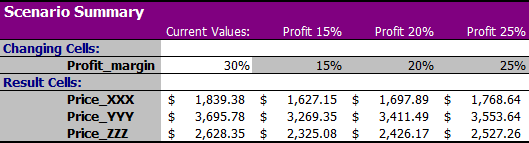
Use the Scenario Manager to determine the selling prices (including VAT) for profit margin rates of 15%, 20%, 25%, and 30%. The output should resemble the following:
Exercise 11.2 Budget - Sports Club (scen002)
File: Scen002.xlsx
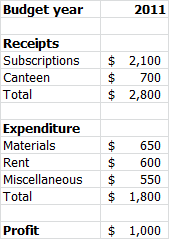
The figure below shows a simplified budget for a sports club. The rent is a fixed amount. For the other items, reasonable estimates of the lower and upper limits are provided:
- Subscription revenues range from $1,800 to $2,400.
- Canteen revenues range from $600 to $800.
- Material costs range from $500 to $800.
- Miscellaneous costs range from $400 to $700.
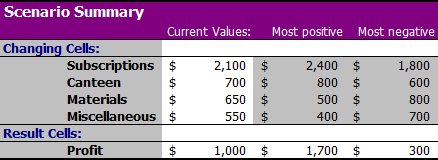
Enter the model in a worksheet. Create with the Scenario Manager the most positive and most negative scenario. The output should look like the following:
Exercise 11.3 Scenarios business profit (scen003)
File: Scen003.xlsx
A company makes three products (A, B en C). To manufacture each product a different number of working hours and materials is needed. In the following figure, you see the rates for labor and material costs as well as the quantities needed to make these products. Also, the costs and revenues are calculated for the current production quantities.
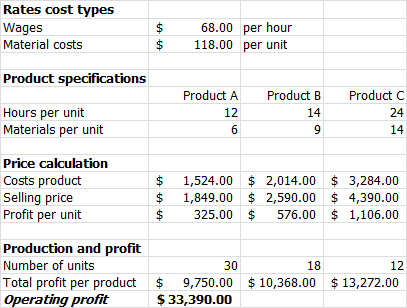
Enter the model in a worksheet. Provide the right formulas in the cells in which values have to be calculated.
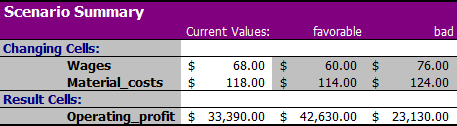
Management wants a prediction of the operating profit, but there is still some uncertainty about the amount of labor and material costs. For the prediction are therefore three scenarios available: the favorable case, the bad case, and the current (most likely) case. The different rates are listed in the following table.
| scenario | wages | material costs |
|---|---|---|
| favorable | $ 60 | $ 114 |
| bad | $ 76 | $ 124 |
| current | $ 68 | $ 118 |
Create a summary report for these three scenarios using the Scenario Manager.
Exercise 11.4 Automation Company Earnings(scen004)
File: Scen004.xlsx
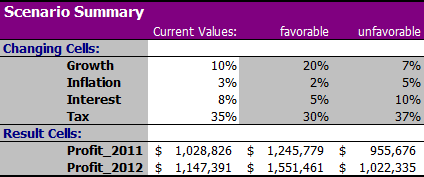
The revenues and expenditures of an automation company for 2010 are shown in the figure below. The executive board wants to create a profit forecast for 2011 and 2012. The revenues and expenditures for these two years are influenced by the following factors:
- All revenues increase by a growth factor, currently 10%.
- All expenditures, except interest, increase by an inflation factor, currently 3%.
- The interest rate is currently 8%.
- The tax percentage is currently 35%.
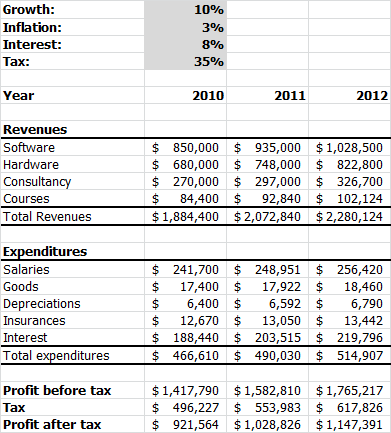
Create this model in a worksheet. The revenues and expenditures for 2010 are fixed and these should be calculated for 2011 and 2012. Provide the right formulas in the cells whose values have to be calculated.
Management wants a prediction of the profit forecast, but there is still some uncertainty about the development of some factors that affect the profit. The central planning bureau has released predictions of these factors. Based on these predictions three scenario’s are computed:
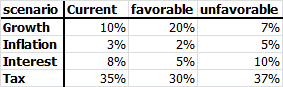
Create this model in a worksheet. The revenues and expenditures for 2010 are fixed, and the values for 2011 and 2012 should be calculated using formulas.